Uploaded image for project: 'OSCAR'
  1. OSCAR
  2. OS-8398

Planning View - Show/Hide datasets values in charts

Insert Lucidchart DiagramSend email
    XporterXMLWordPrintable

Details

    • Task
    • Resolution: Completed
    • Medium
    • 5.3
    • None
    • BSL
    • None

    Description

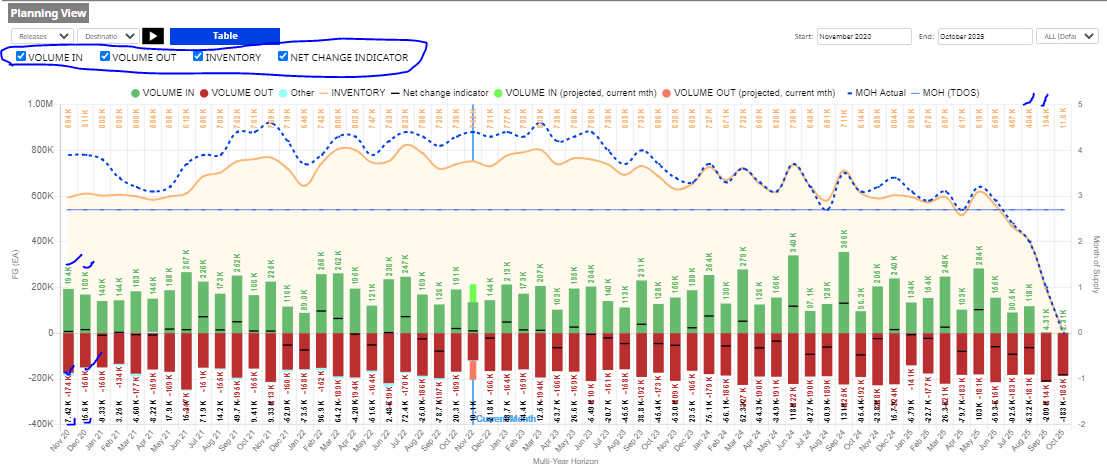
      • Create four check boxes VOLUME IN, VOLUME OUT, INVENTORY and NET CHANGE INDICATOR in planning view chart detailed view.
      • whenever we check/uncheck check boxes that corresponding values (animation text) should be show/hide. (ex. if we uncheck VOLUME IN checkbox, then values should be hidden for that VOLUME IN bar)
      • Show in Detailed View only, as per the image above (Box with DATA ANNOTATIONS header)
      • Don’t show in Normal View J
      • Move data annotations box to centre and align bottom of box to bottom of table button
      • Click on legend to activate/deactivate data in chart (as per current functionality)
      • Click on data annotation check box to activate/deactivate annotations (only) – TBC if possible (Raju/Katia)
      • Ideally, default Detailed View should show only Inventory and NCI data annotations (with their boxes ticked)
      • If not possible to activate/deactivate annotations (only) , then default Detailed View should show all data annotations
      •  

      Attachments

        Activity

          People

            BONDUR Bondugula, Raju
            TSIROA Tsironi, Katia
            Votes:
            0 Vote for this issue
            Watchers:
            1 Start watching this issue

            Dates

              Created:
              Updated:
              Resolved:

              Time Tracking

                Estimated:
                Original Estimate - 3 days Original Estimate - 3 days
                3d
                Remaining:
                Remaining Estimate - 0 minutes
                0m
                Logged:
                Time Spent - 4 days
                4d