Details
-
Change
-
Resolution: Unresolved
-
 Medium
-
None
-
None
-
IO Sprint 147, IO Sprint 148
-
Non-GxP
-
A
Description
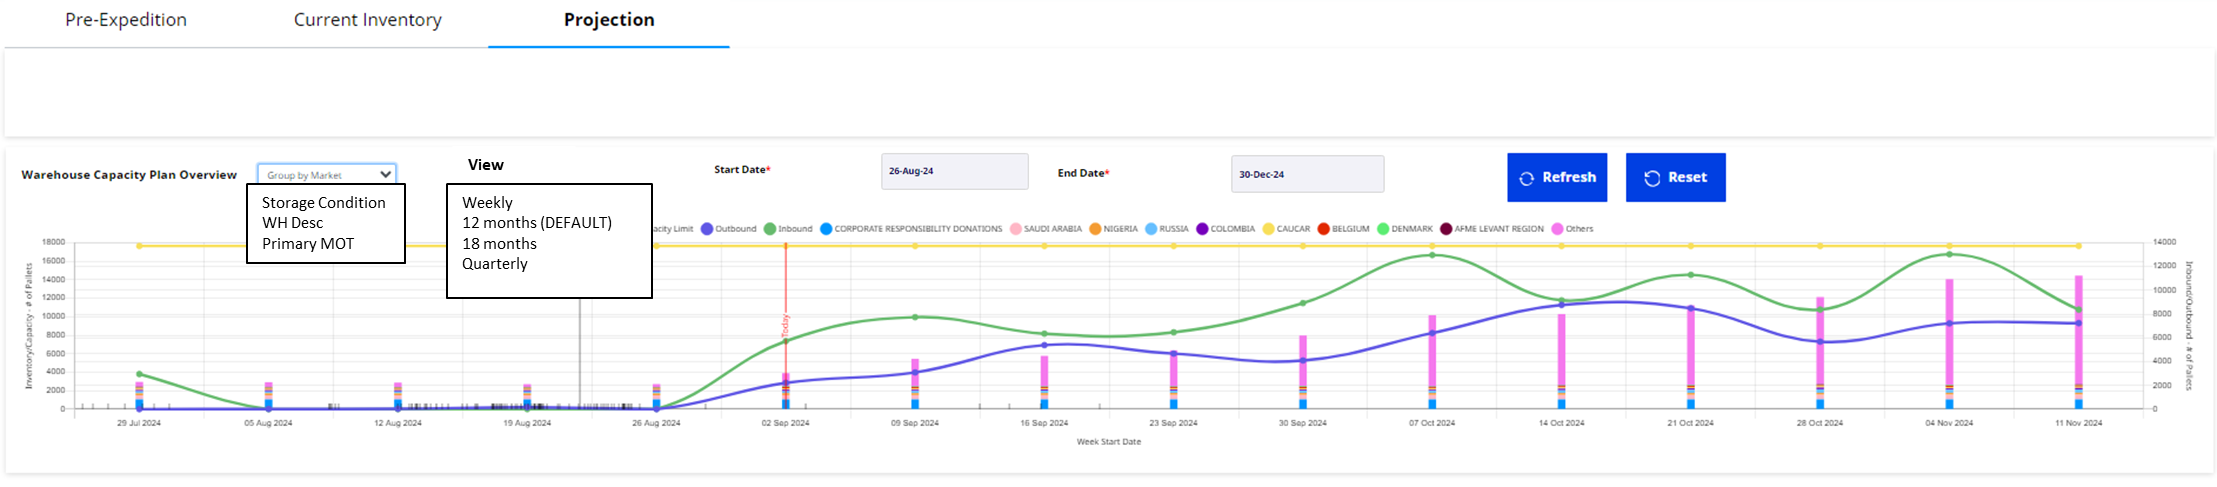
As a WHC planner, I need the current WHC planning graph to reflect projections in a monthly view (12 months) so that i can relate to the data shown in the bottom projections table.
Description: The current WHC planning graph should utilize the data shown in the new projections table. The grouping options to be enabled for the graph are Market, Storage Condition, Warehouse Description and Primary MOT. As a default, the projections graph should open to a default 12 monthly view starting from the current week. Apart from this, there should be option for view selection between weekly, 12 months, 18 months or Quarterly. Start date and end date option should be given only for weekly view. The weekly view should be enabled for a selection of upto Max 36 weeks. Quarterly view should show data for 8 quarters from current month.
qTest: Test Execution
Attachments
Issue Links
- has to be done after
-
OS-21276 Requirement Gathering : OS-21273 - Projections View Graph Addition
-
- Closed
-
-
-
- Closed
-
- relates to
-
OS-21278 Test Script review : OS-21273 - Projections View Graph Addition
-
- Yet to start
-
-
-
- Yet to start
-
-
-
- Done
-
-
-
- Done
-

