Uploaded image for project: 'OSCAR'
  1. OSCAR
  2. OS-19643

TC EXEC - Chart Section | Completion of Work

Insert Lucidchart DiagramSend email
    XporterXMLWordPrintable

Details

    • Task
    • Resolution: Completed
    • Medium
    • 11.0
    • None
    • IMDP
    • None

    Description

      Left Section: Starting, Model, Final
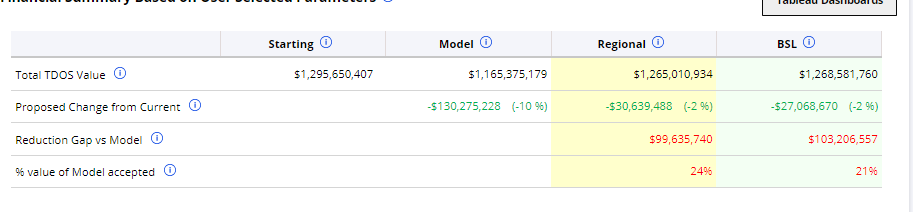
      Graph from Excel:

      (Final-Starting TDOS)*Daily COS = Impact$

      Regional Reviewer/Market Planner - when they see the graph first time - they will see split in terms of Sub Business Units

      Others - BSL/Admin - they will see split in terms of region

      Market - Show top 10 Markets

      SubBU/Region - will always be 5-6 columns


      Attachments

        1. Inventory Optimizer Report (72).xlsx
          1.62 MB
          Solaikumar, Lakshmi
        2. Inventory Optimizer Report (69).xlsx
          25 kB
          Solaikumar, Lakshmi
        3. image-2024-05-16-11-50-09-555.png
          21 kB
          Gupta, Kshitiz
        4. Chart Validation Market.docx
          1.99 MB
          Solaikumar, Lakshmi
        5. Chart Validation BSL.xlsx
          14 kB
          Solaikumar, Lakshmi
        6. Chart Validation BSL_1.docx
          1.61 MB
          Solaikumar, Lakshmi
        7. Chart Validation Admin.docx
          1.21 MB
          Solaikumar, Lakshmi

        Issue Links

          Activity

            People

              SOLAIL Solaikumar, Lakshmi
              RKAMAR R Kamath, Rahul
              Votes:
              0 Vote for this issue
              Watchers:
              2 Start watching this issue

              Dates

                Created:
                Updated:
                Resolved:

                Time Tracking

                  Estimated:
                  Original Estimate - 3 days
                  3d
                  Remaining:
                  Remaining Estimate - 0 minutes
                  0m
                  Logged:
                  Time Spent - 4 hours Time Not Required
                  4h